How to Use Python in PowerPoint
Daily, monthly or even yearly reporting might take an important place in many corporate employees’ timetable. Creating and updating slides to support your presentations can be a time-consuming activity, and maybe not the most intellectually stimulating one.
If you are regularly updating the same slides with new data, you might save time by automating the process.
The Python package “python-pptx” can help you doing so. The library provides high level Python objects to interact with a PowerPoint file, so you can create new presentations or edit an existing one within Python. Because it is hard to create elegant presentations from scratch only with lines of codes, the most straightforward approach is to start creating a template file which will be edited by your python script. Once the main file has been loaded, the library allows many operations:
- Replacing text within the slide: You can edit, create and replace text in your template’s shapes.
- Duplicating and removing slides: You might have slides with a similar structure but different data. In that case, duplicating the template and updating each new slide could be an interesting option to save time. Once done, you can remove the template slide.
- Updating chart data: Python-pptx provides interfaces to work with charts within your presentation. Even if you can create a new chart from scratch, the easiest way is often to update an existing one in the template.
Using Python in PowerPoint: Practical Case
To give a simple example, we will be automating the process of creating a simple presentation that shows the latest financials data of a few well-known companies. We will use publicly available data, which will be fetched from the Yahoo Finance API within the python script.
Our needs are very basic, we would like to have the following slides:
- A title slide to introduce the presentation, with the last update date.
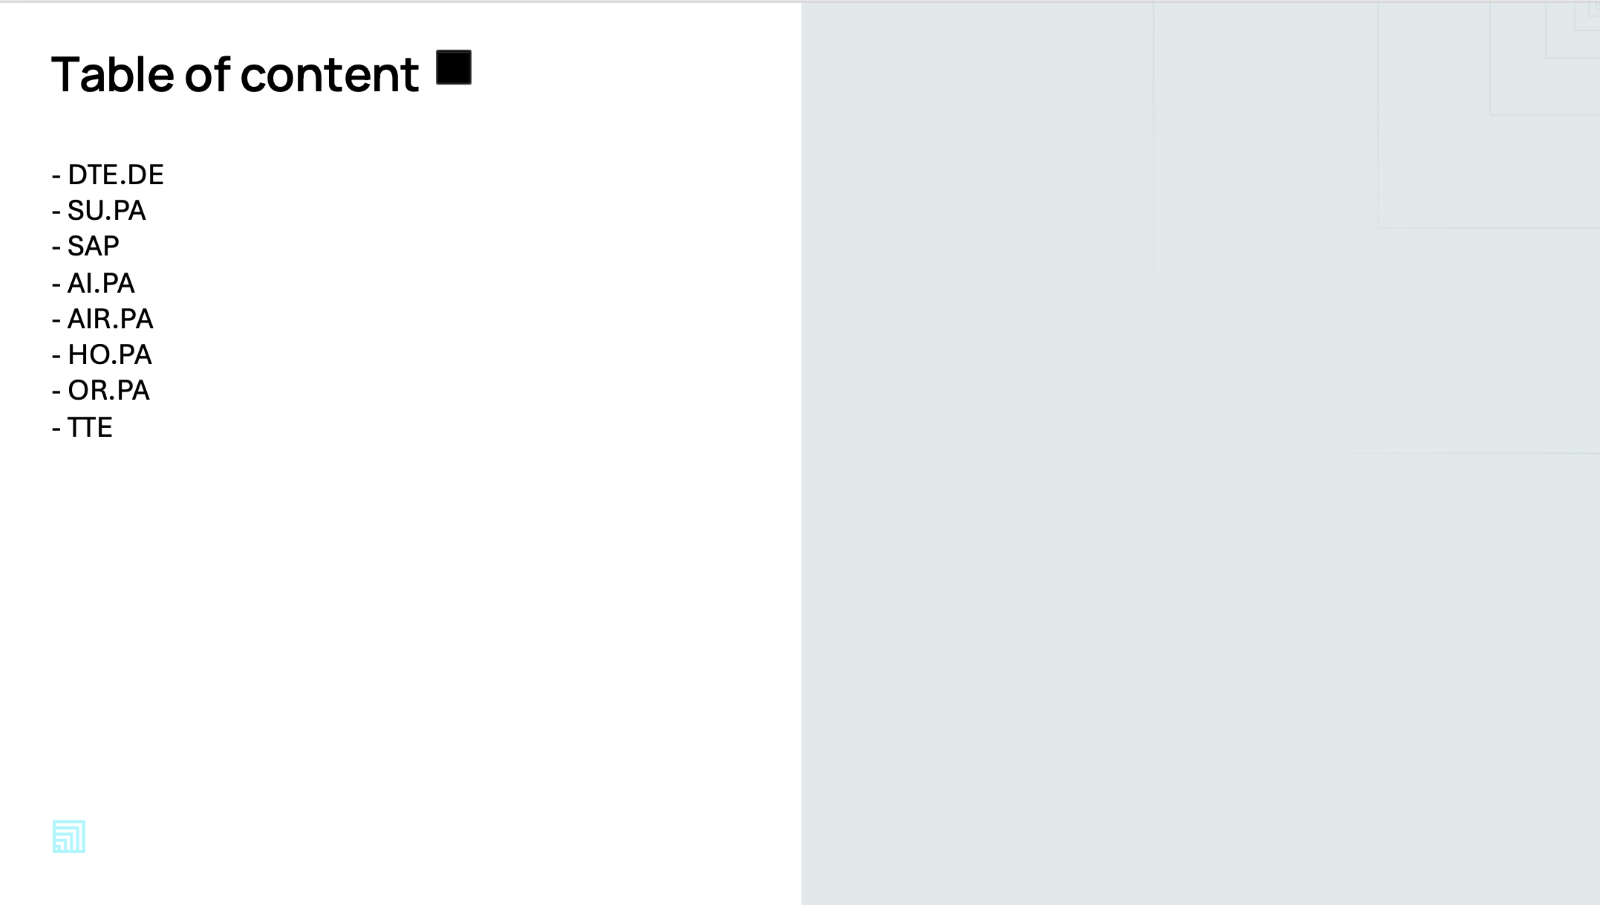
- A table of content slide, with the name of the companies we are going to introduce.
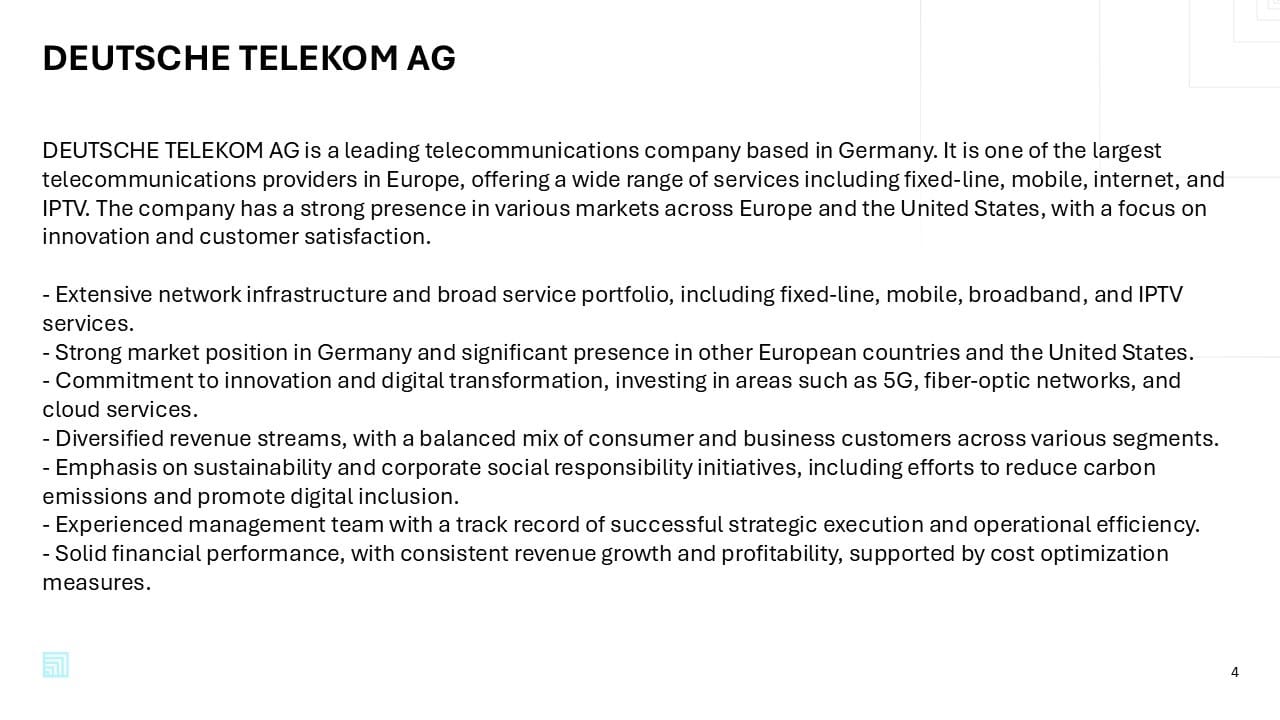
- For each company, a textual introduction slide.
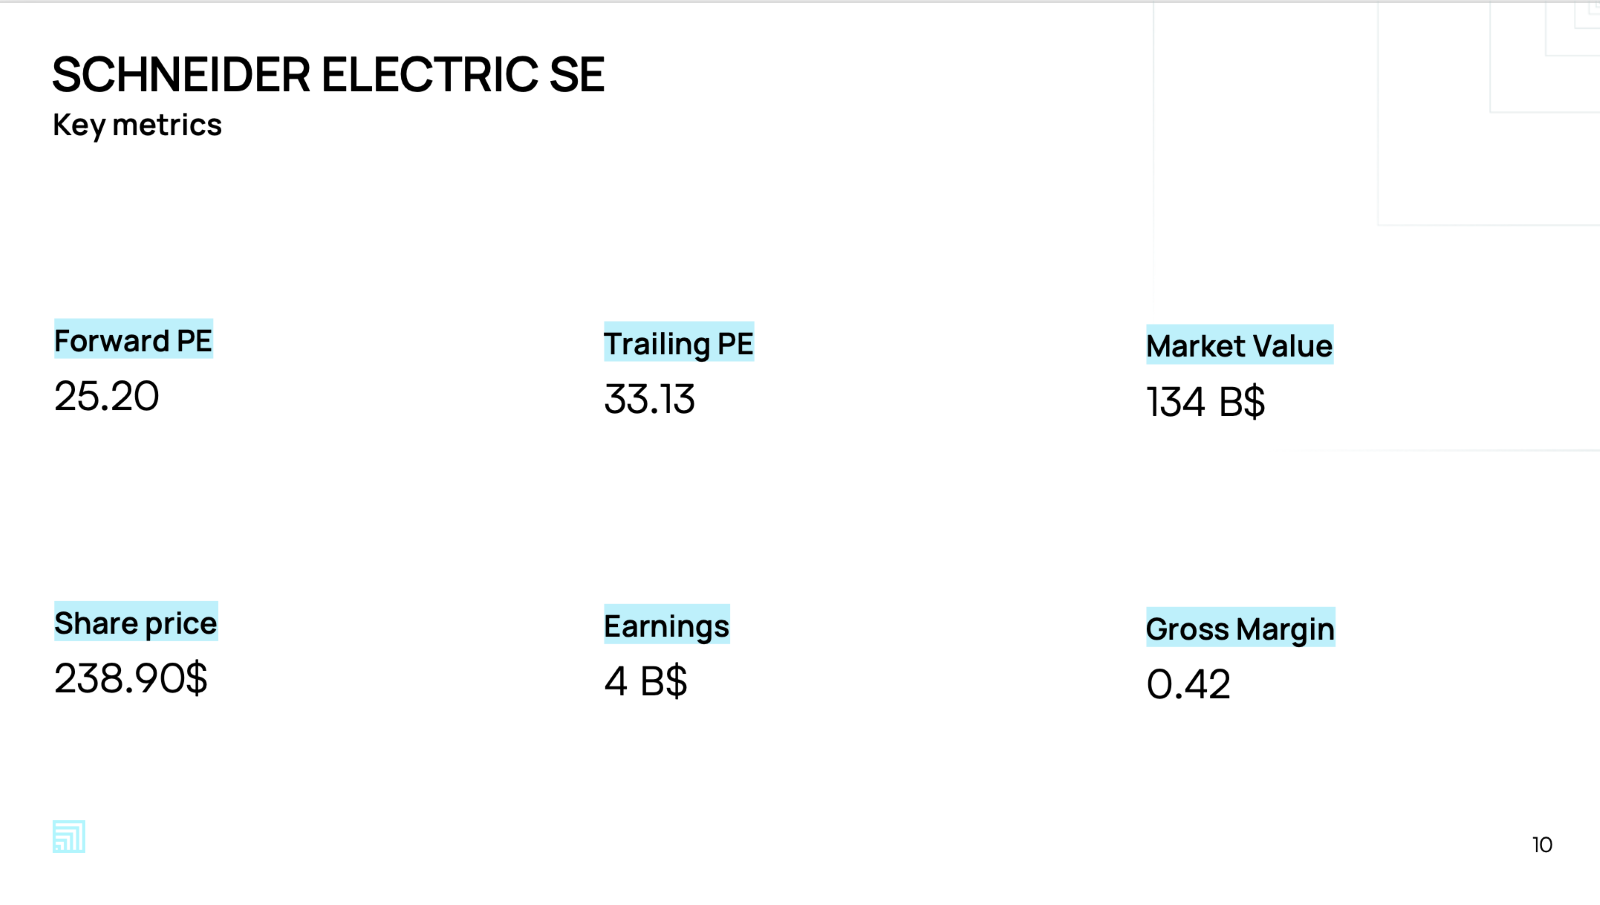
- For each company, a slide to display some KPIs.
- For each company, a slide which shows the evolution of financial metrics within a bar chart.
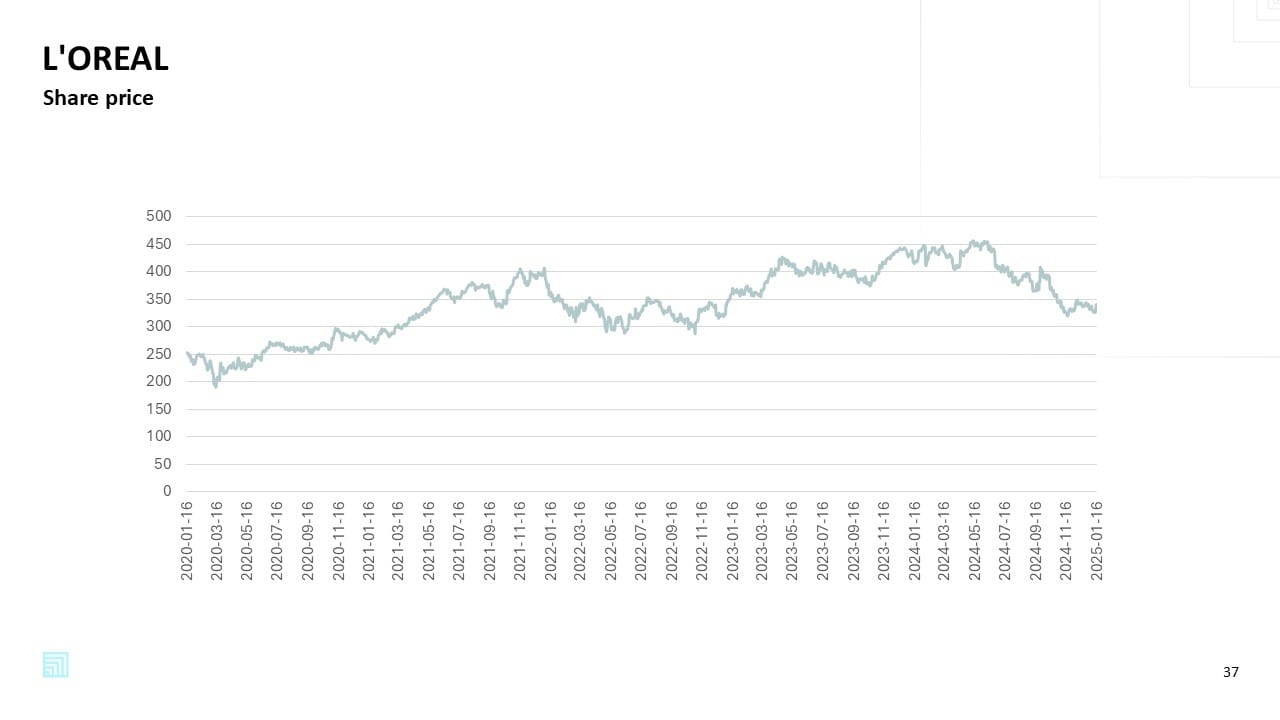
- For each company, the evolution of the share price in a line chart.
- And at the end, why not creating a small conclusion
We would like to present shortly each company. To do so, we can use the official company summary, which is provided by Yahoo Finance, but there is another way. We could ask to a Large Language Model to create a few bullets points, so the format will match exactly our needs for the slide. In this article we will be using Claude 3.5, provided by AWS Bedrock API. For each call, we created a generic prompt, and we will complete it within Python with runtime data.
Since we decided to add LLM generated content to enhance our presentation, we can also ask the AI to choose the best investments within the list. Our last slide will present the top three companies the model has selected for us.
The implementation will follow these steps:
- Create the template file: Create a template for each slide you want in your final presentation. Create the required shapes and text areas that will be filled later. Apply some styling to make things pretty.
- Fetch external data: Our Python code will need to fetch external data to fill the presentation. We decided to use the Yahoo Finance API, which has a Python wrapper, and to generate text with Bedrock, which we can call with the Boto3 client.
- Create functions for each of your slides: Create a Python function for each slide, which makes the links between your data and the shapes in your template file.
- Loop on your data to create the required slides: You can loop on your data, to make the presentation dynamically match the desired structure.
- Export the presentation: Once done, Python can export your updates to a new pptx file, so the final user can open it with Power Point.
Here’s a simple overview of the result:


For the following slide, we asked Claude v3.5 to create a summary and a few bullets points to describe the company, instead of just using data available online. The LLM allows us to have a textual content that matches the exact format we want, so it integrates well within the presentation.
In the next slide, a little text formatting is required, because of numbers’ diversity. We need to anticipate that the earnings of a company can be quite a large number, which should therefore be simplified.
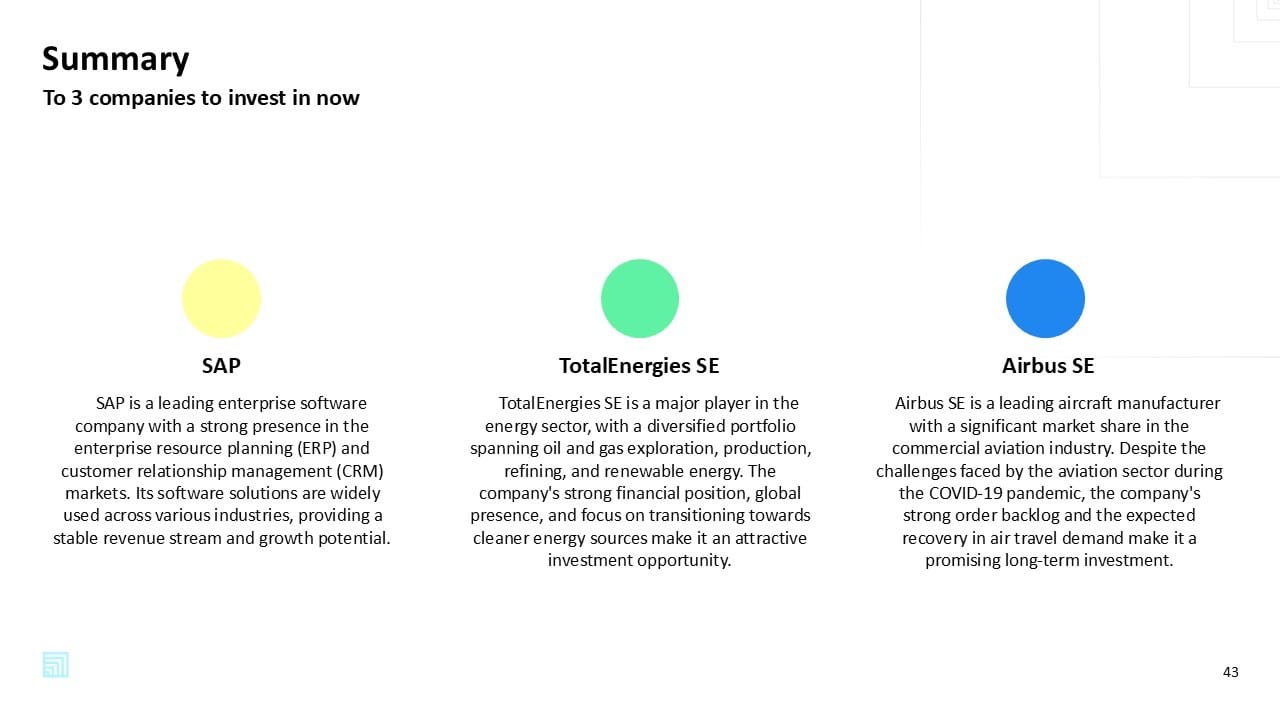
For the last slide, we asked the LLM to recommend to us three companies to invest in with a small justification. We can ask the model to match a given formatting so we can extract companies’ names and for each of them the justification. Once everything has been extracted, we can fill our template with the data.
The code for the example is available on Github, at the address
A few ideas
Here are a few ideas to go further and automate more redundant tasks:
- Use AI generated images to illustrate your presentations given its conten
- Fetch data from your ERP’s API, to create presentations with your companies’ data.
- Schedule the generation process, within your CI/CD or scheduler to receive the updated presentation every morning.
- Create support for your scrum meetings connecting your script to JIRA.
- Update automatically your generic slides with a given customer’s data.
- Update automatically your sales presentation with the latest values for some metrics.